Overview
Moving on to the PFD. This may be the shortest part yet.
We intend to make a Phase Frequency Detector (PFD) by capturing the edge of the signals, positive edge to be specific.
This is an important takeaway because, by adopting a positive edge-detecting PFD, the feedback signal coming back from the frequency divider does not have to be a 50% duty cycled signal.
It becomes possible to implement power-efficient divider designs without placing stress on achieving a 50% duty cycle.
Design Topology
The topology for our PFD looks like this:
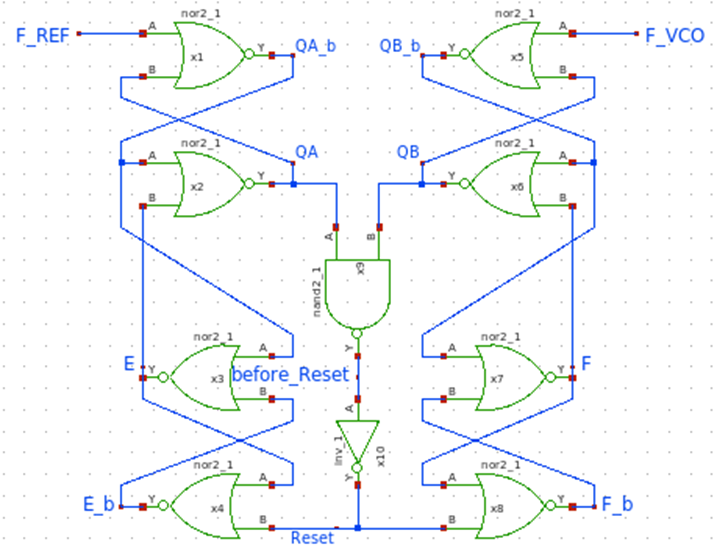
Figure 1
To evaluate this topology, we observe its time response operation step by step.
Step-by-Step Signal Analysis
First, we apply the two input signals as shown in Figure 2. The signal on the left is the reference 20 MHz pulse, and the signal on the right is the feedback 20 MHz pulse lagging by 1 ns, coming back from the VCO-Freqency_Divider cascasde.
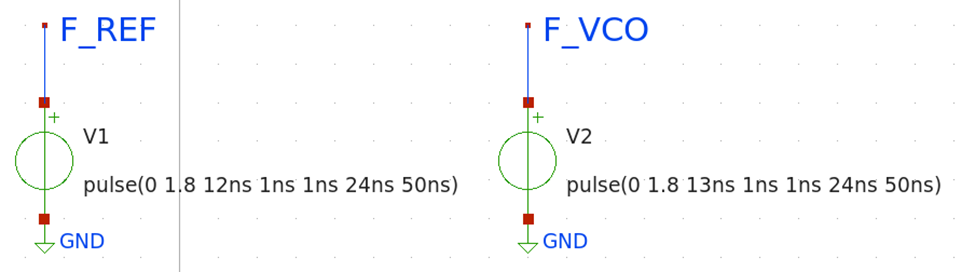
Figure 2
Its representation is shown in Figure 3.
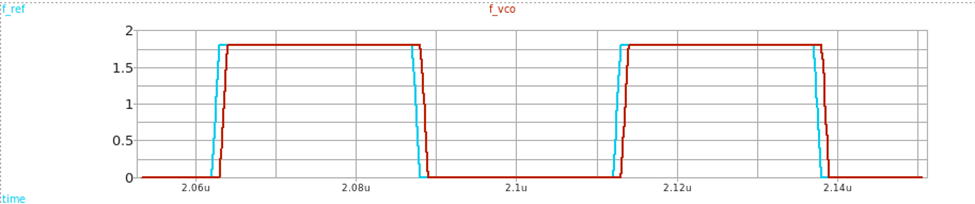
Figure 3
Figure 4 shows the close-up behavior of the two signals.
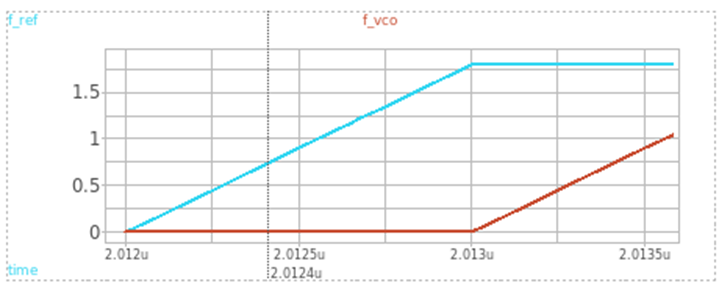
Figure 4
Transient Response of NOR Blocks
Figure 5 ~ 13 shows the transient response of their two input signals and one output signal from the NOR blocks in Figure 1.
X1~X4 are the NOR blocks from the F_REF detecting side, and X5~X8 are for F_VCO, respectively. All signals are color-coded simultaneously among graphs on the left side (X1~X4) as well as the right side.
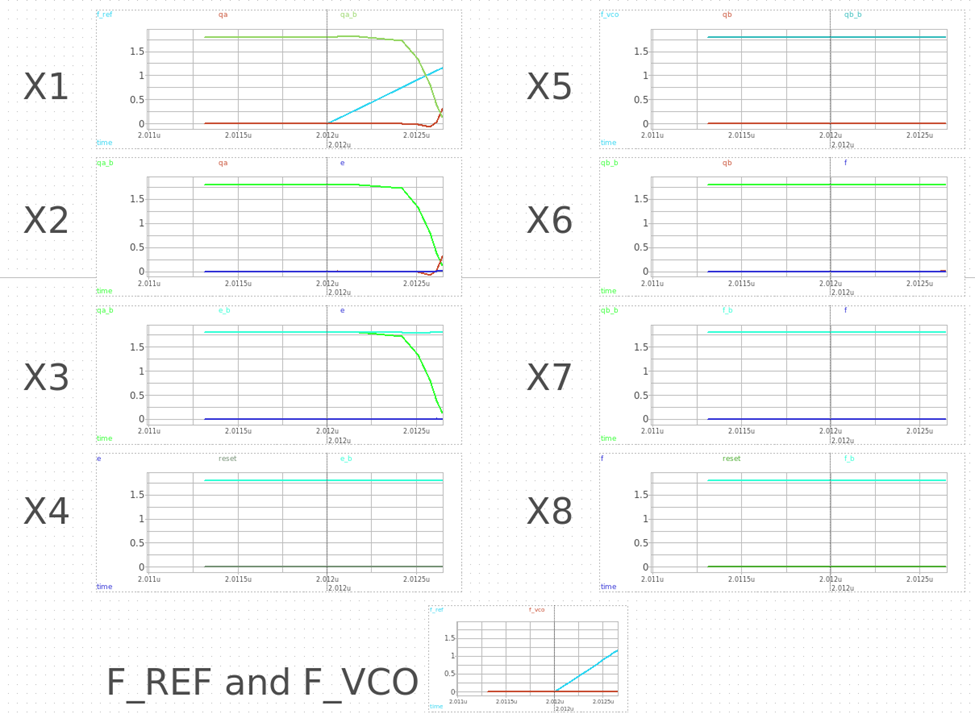
Figure 5
Time-Resolved Analysis
At 2.0124us: F_REF rises enough to trigger DOWN the X1 NOR output, which is the node QA_b.
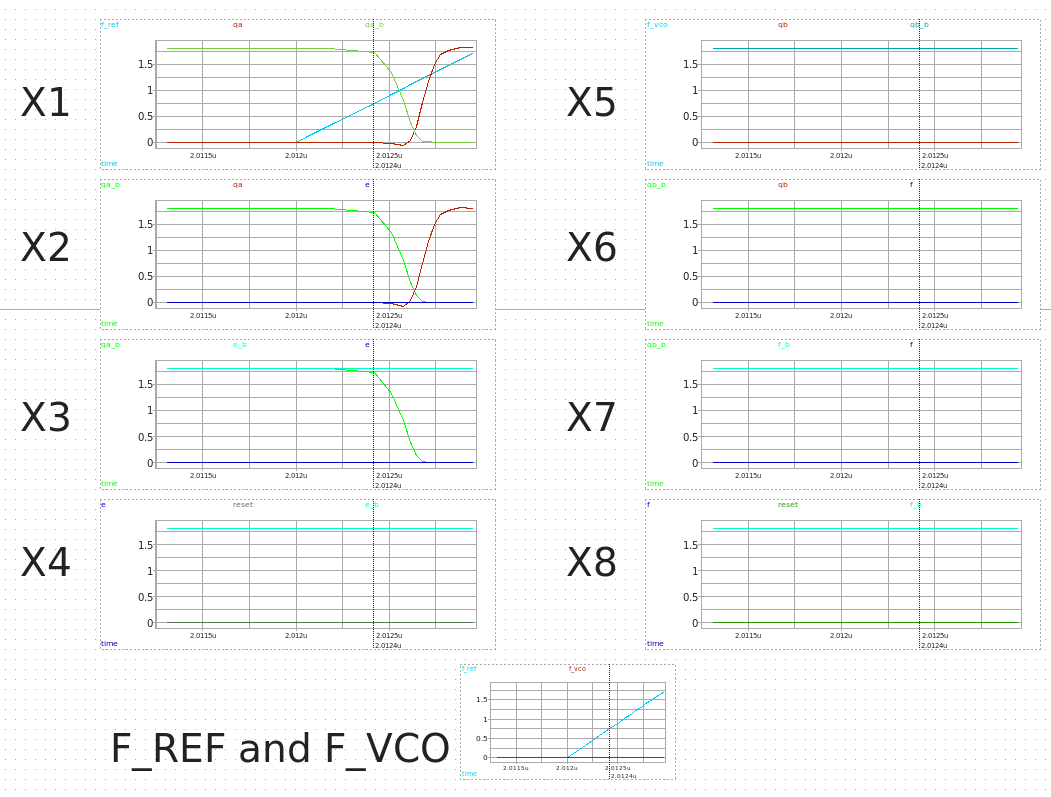
Figure 6
At 2.0126us: QA_b is entirely DOWN, and this triggers QA to go UP in the X2 NOR output.
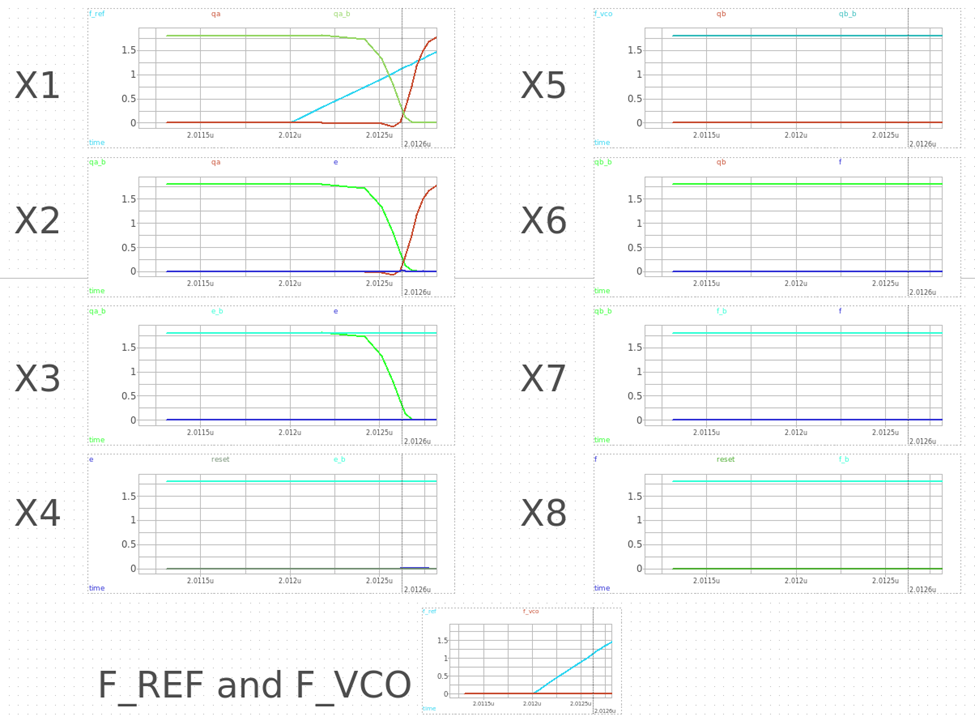
Figure 7
At 2.0128us: QA is entirely UP.
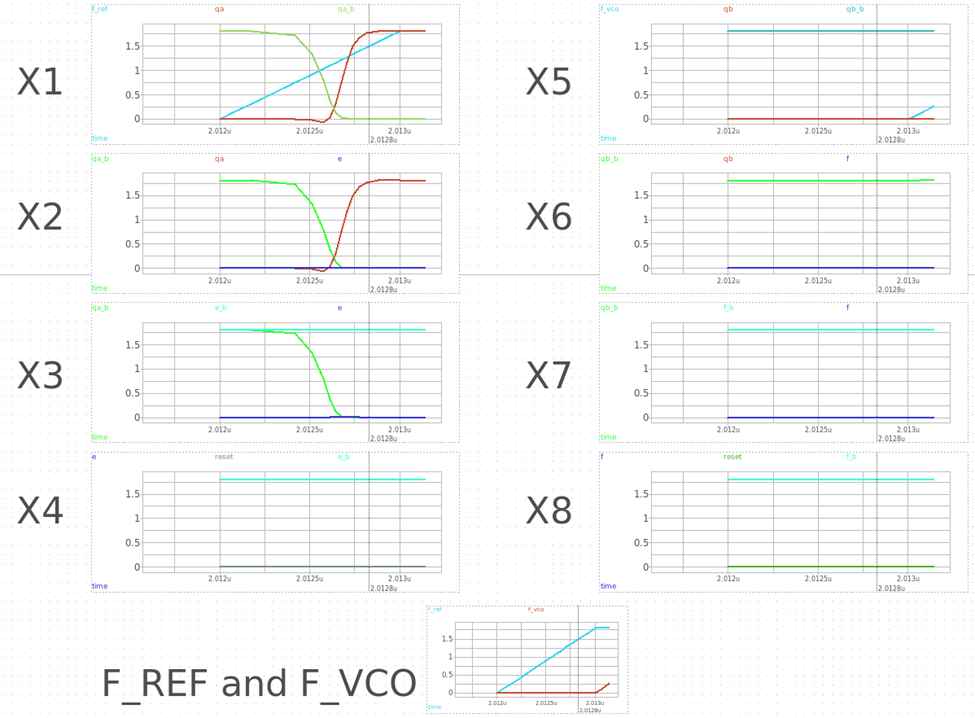
Figure 8
At 2.0130us: F_VCO starts to rise.
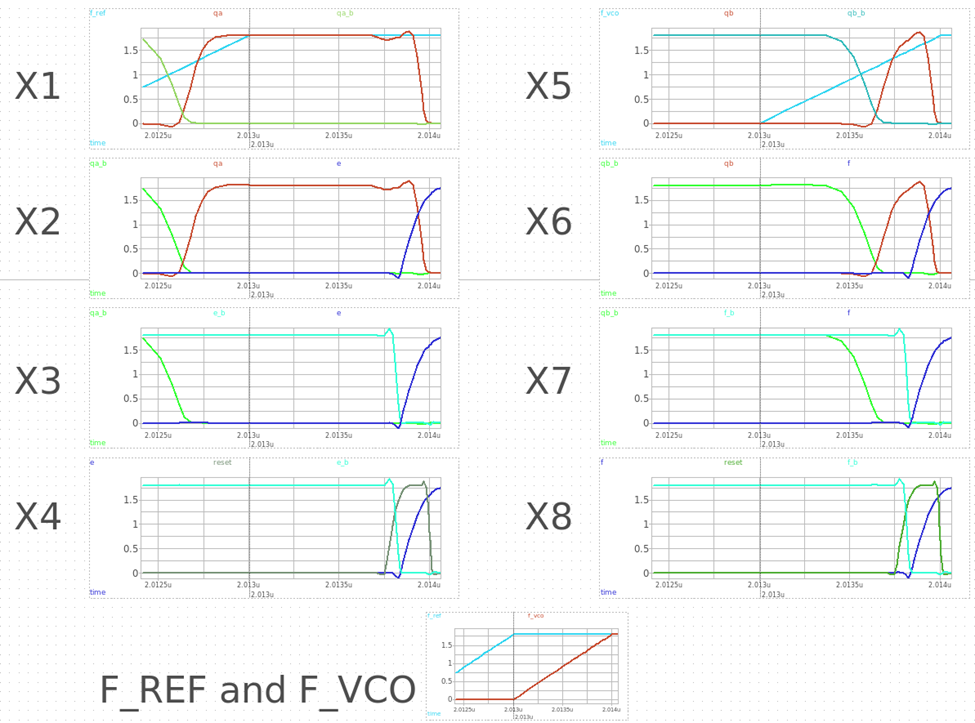
Figure 9
At 2.0134us: F_VCO rises enough to trigger DOWN the X5 NOR output, which is the node QB_b.
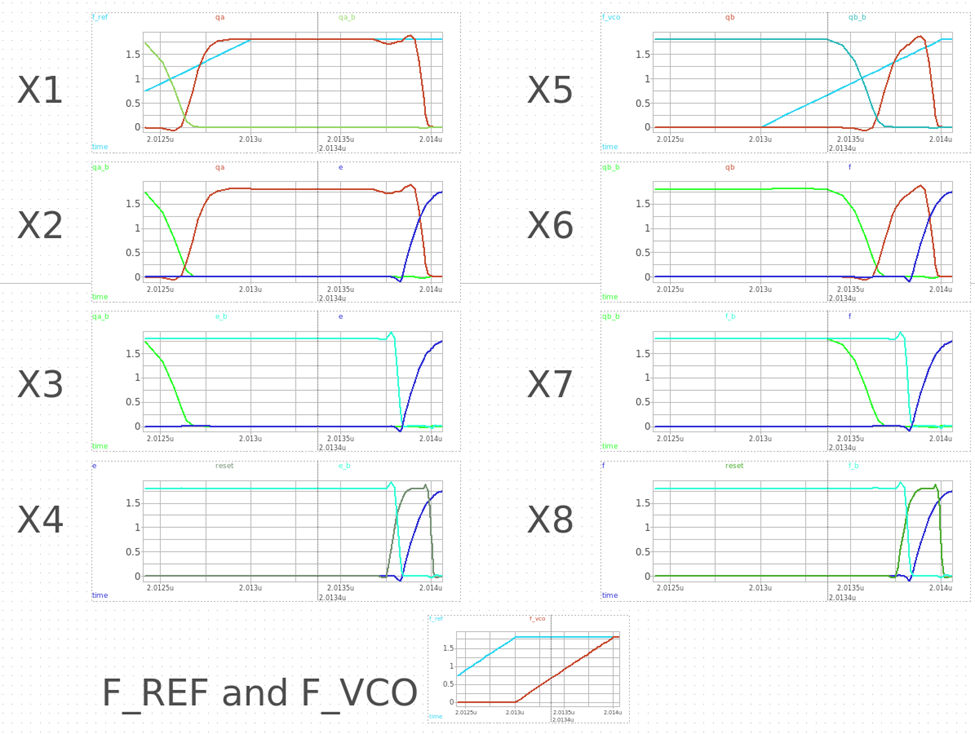
Figure 10
At 2.0136us: QB_b is entirely DOWN, and this triggers QB to go UP in X6 NOR output.
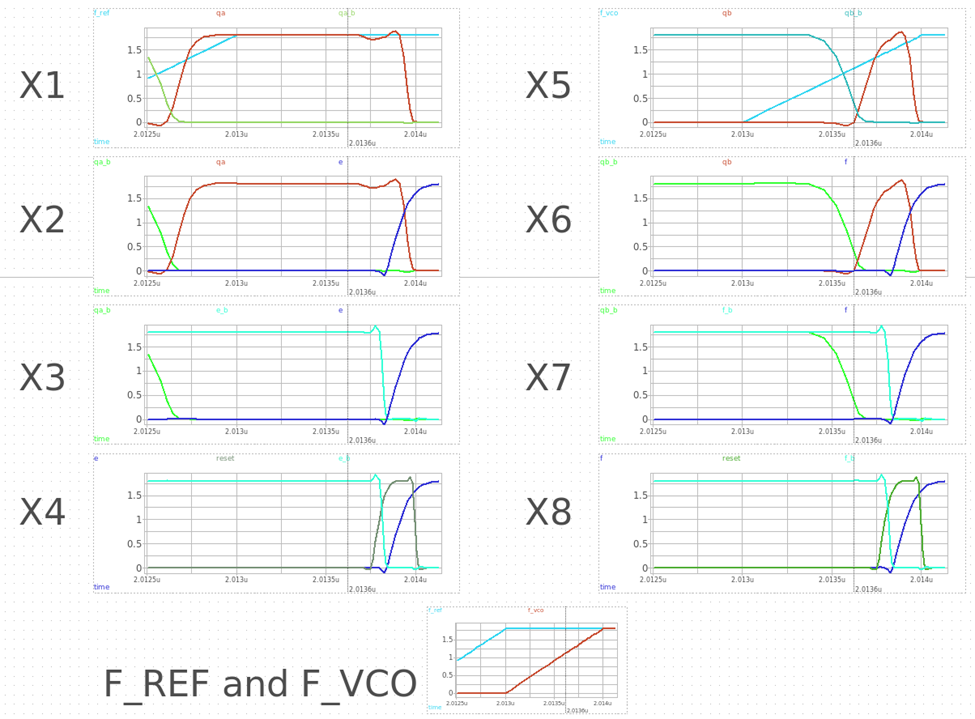
Figure 11
At 2.0138us: Now QB is entirely UP, this means that the second signal has detected, and the interval between QA and QB is the time difference between F_REF and F_VCO. Therefore, that amount of information will be passed down to the CP. Moving on, the X9 AND block now has its two inputs UP, which leads to its output (RESET) also being UP.
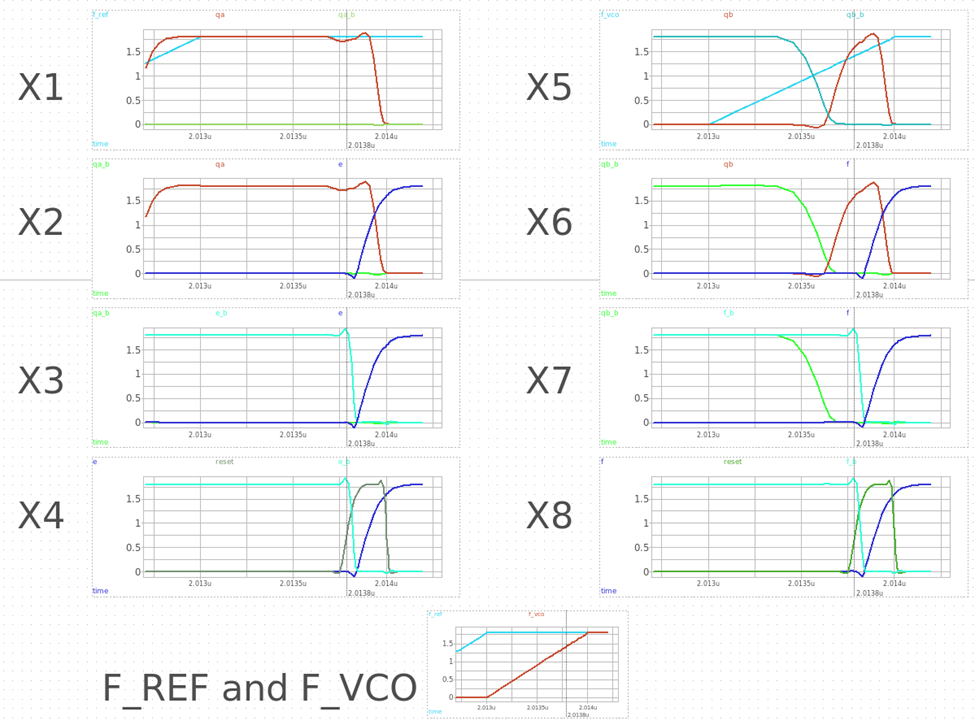
Figure 12
At 2.0140us: The UP RESET signal reaches the input of X4 and X8 NOR block, which simultaneously triggers the X2 and X6 NOR blocks and finally driving it to go DOWN.
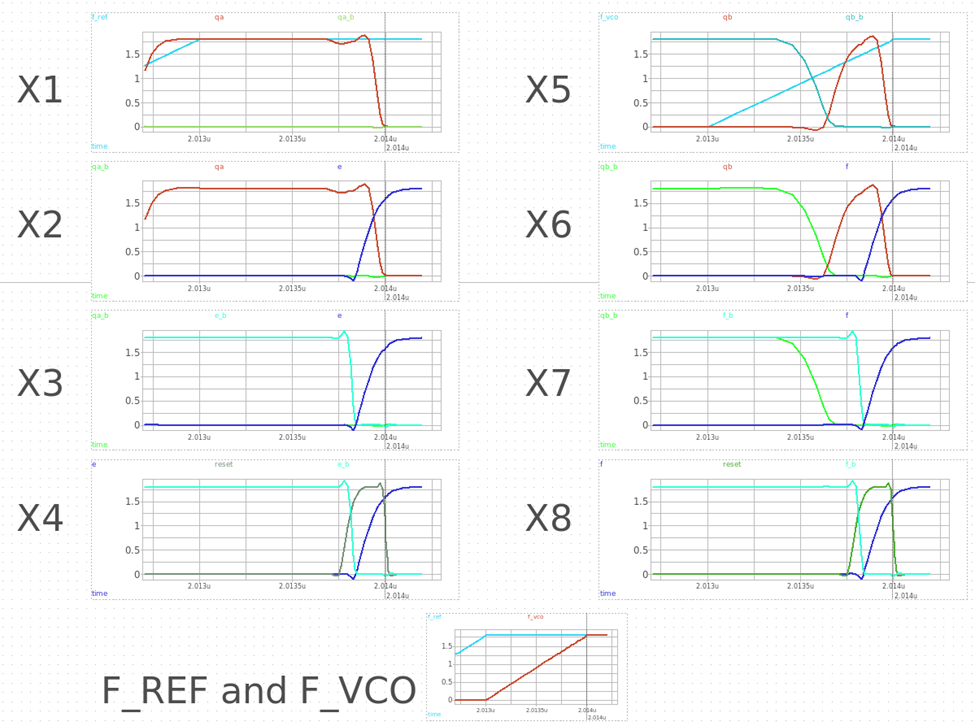
Figure 13
Final Outputs
The whole process was to create a pulse signal for the CP input, as shown below.
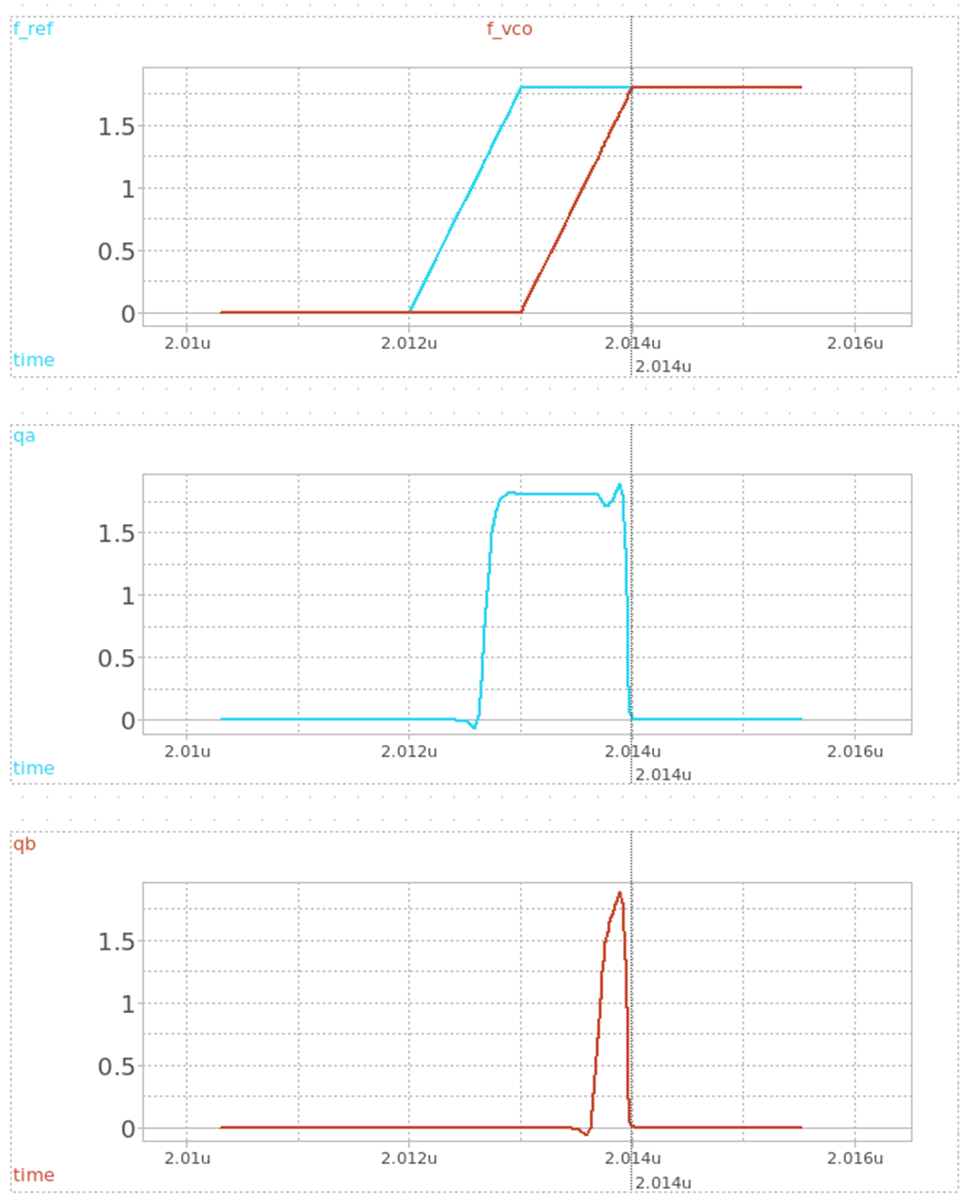
Figure 14
There is one more thing to discuss: applying additive inverters to the output to ensure delays for small phase frequency differences. This is done to avoid dead zone issues in PFD and CP.
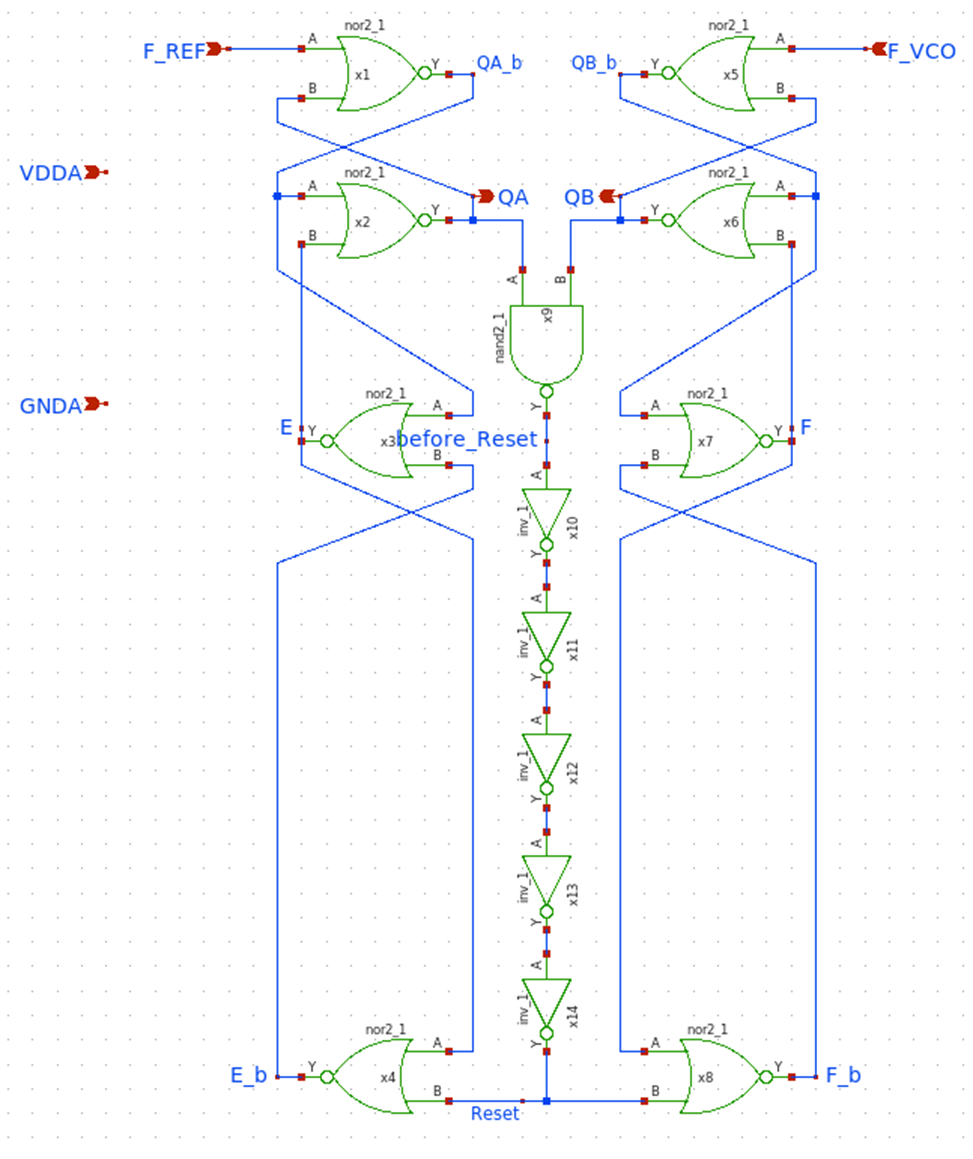
Figure 15
After such an approach, for sequences where the two input signals are in coordination, we still get to see some signals in the output, which will ensure that our PFD-CP design would not fall into a dead zone.
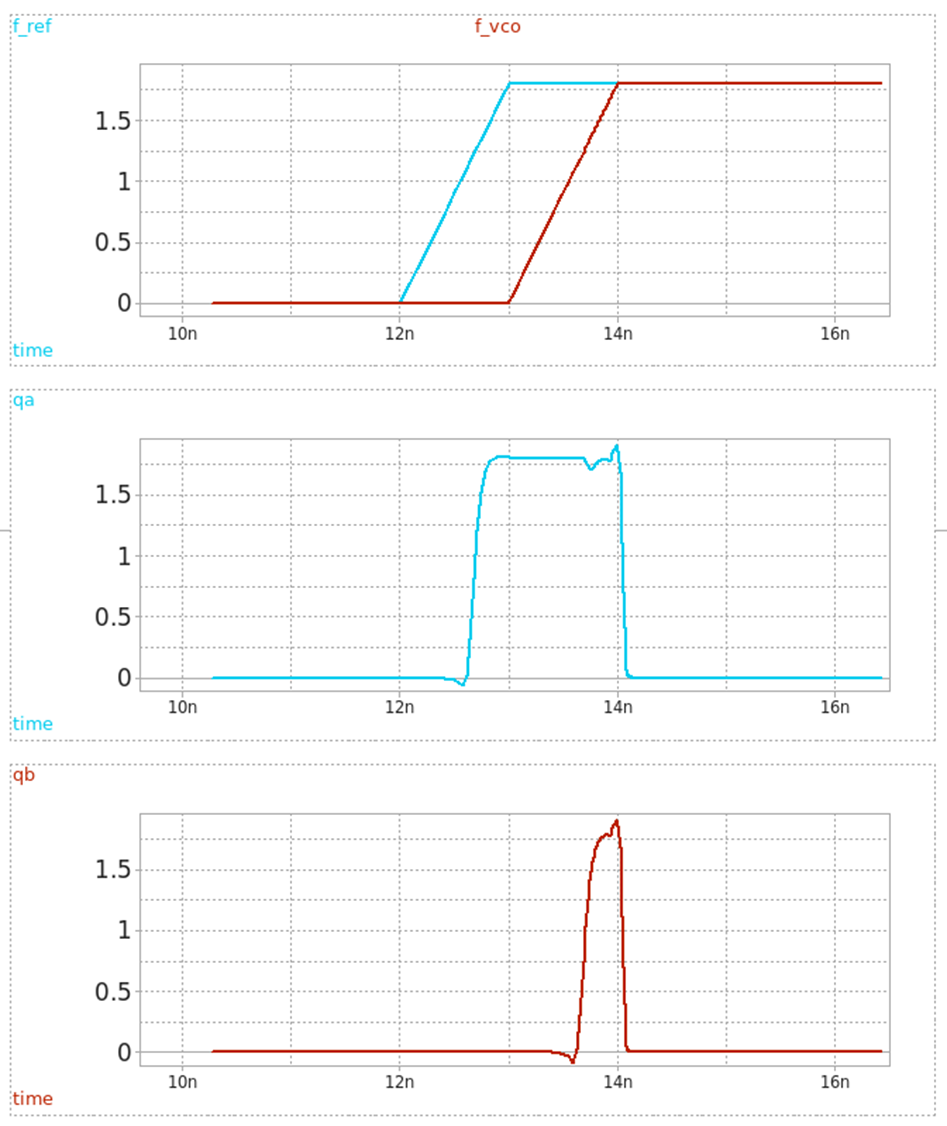
Figure 16
Conclusion
This completes the design and analysis of the phase frequency detector. Stay tuned for the next post on charge pumps and further integration!
Discussion
Comments
Share questions, corrections, or notes through GitHub.