From the previous post “Voltage Controlled Oscillator Design,” we obtained the Kvco as 362 MHz/V.
Back in the post “Design Parameters Part 1,” we left off , , and Kvco undecided.
Now, with Kvco being set, we move on to the derivation of and .
Loop Filter Derivation
From that post, we specifically decided to start from a 2nd order PLL for the loop filter parameter configuration.
Equation 1: 2nd order Closed Loop Transfer Function
This allows us to use control theory to analyze the 2nd-order closed-loop PLL system.
Key Equations
Equation 2: Damping Factor
Equation 3: Natural Frequency
As Eq.3 has just one unknown variable (), we will start deriving from the natural frequency.
Discrete-Time Nature of PLL
First, we need to realize that our PLL carries a Discrete-Time (DT) nature. This is because the VCO is driven by the output of the PFD/CP/Loop Filter cascade, which is a ramp response.
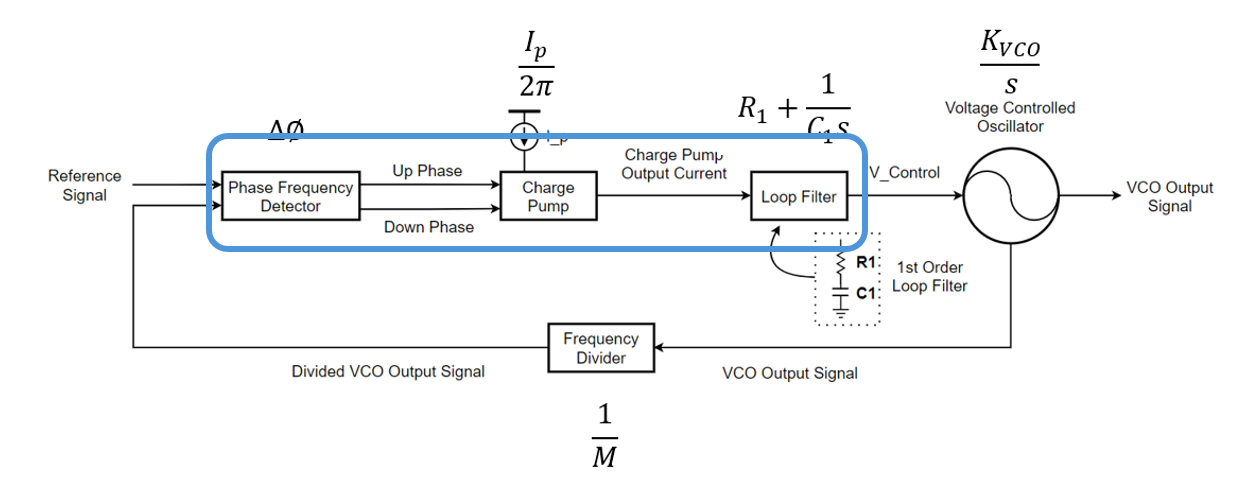
Figure 1: PLL and the Highlighted PFD/CP/Loop Filter Cascade
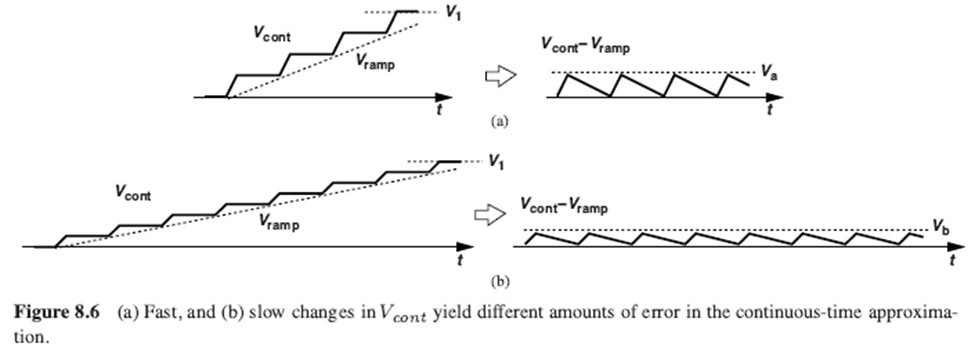
Figure 2: Ramp Response Signal of the PFD/CP/Loop Filter Cascade
This discrete nature interferes with our attempt to view the PLL as a continuous system. However, as shown in Figure 2(b), if we were to state the changes slowly, we can approximate back the system to be a continuous system. By then, the analysis through transfer function gains some reliability.
A rule of thumb to ensure this slow change in the loop is to select the loop bandwidth approximately equal to 1/10 of the input frequency.
We know our input frequency (f_REF) as 20 MHz, thus the loop bandwidth has to be 2 MHz.
Open Loop Bandwidth Selection
But which bandwidth? (3dB cutoff bandwidth of the Closed Loop System) or (unity-gain bandwidth of the Open Loop System)?
Equation 4: Open Loop Transfer Function
If this still raises concerns, we can take further validations.
Say we set the 2nd order system to have a damping factor () of 1, it shows as the figure below.
In such () configuration, it shows the relationships of the bandwidths as , and .
By this, the two bandwidths are close in values, which means that even if we choose over , we can still expect the similar results.
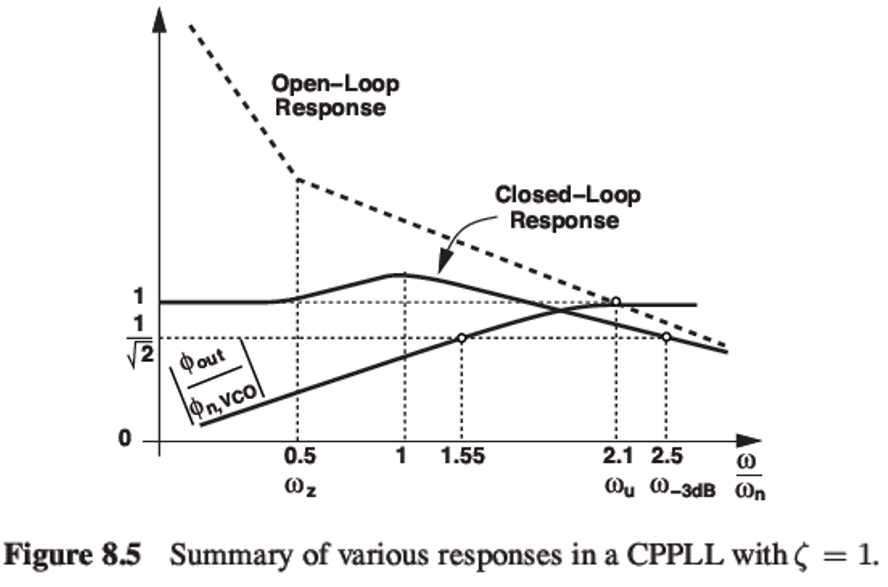
Figure 3: Various PLL Response
Equation 5: Relationship of Reference, Unity-Gain, Natural Frequency
Deriving C1 and R1
Calculating C1
Equation 6: C1 Derivation
Therefore the value of = 8.42pF, and the value of taken as 1/5, which will be roughly = 1.68pF.
Configuring we can move on to the configuration of the value. As we set the damping factor () as 1, the calculation starts from Eq.2 as below.
Calculating R1
Equation 7: R1 Derivation
In conclusion, we have = 42.9kΩ.
Simulation in MATLAB
We validate these values using MATLAB Simulink and the Control System Designer.
Below are the Design Parameters and the Simulink diagram:
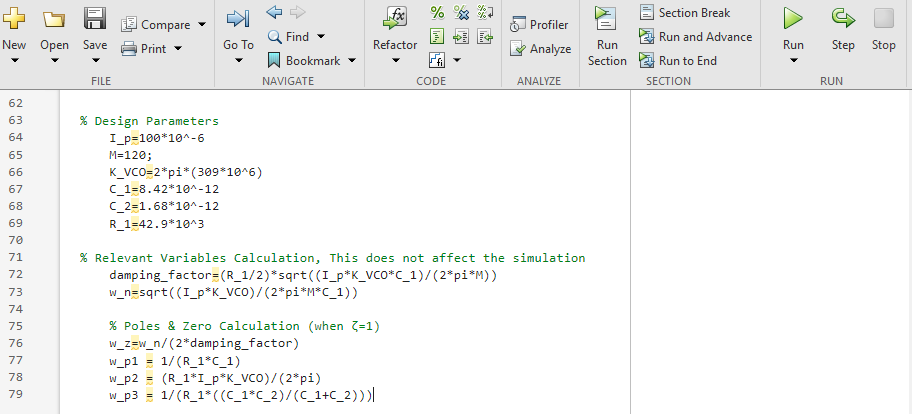
Figure 4: Design Parameters for PLL
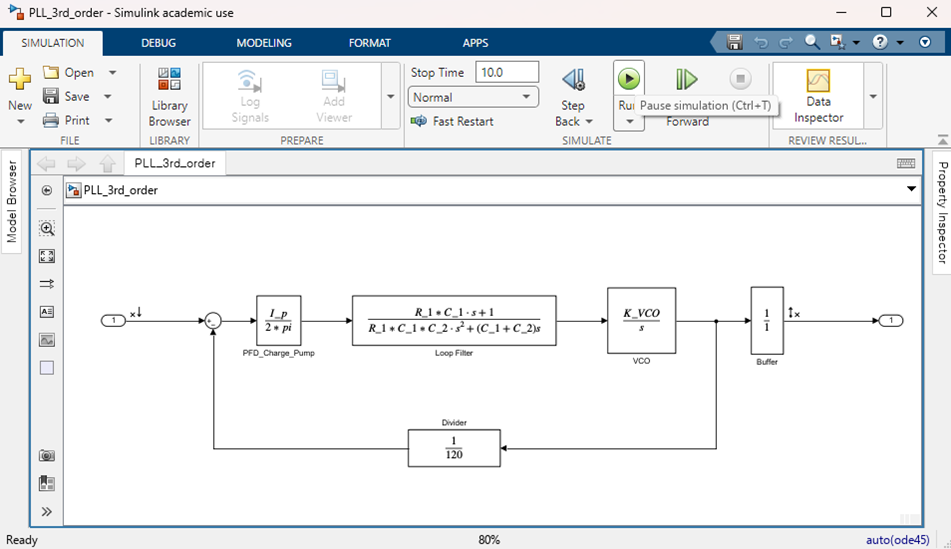
Figure 5: Simulink Diagram for PLL
This represents our target topology that we mentioned in “PLL Design Parameters: Part 1”
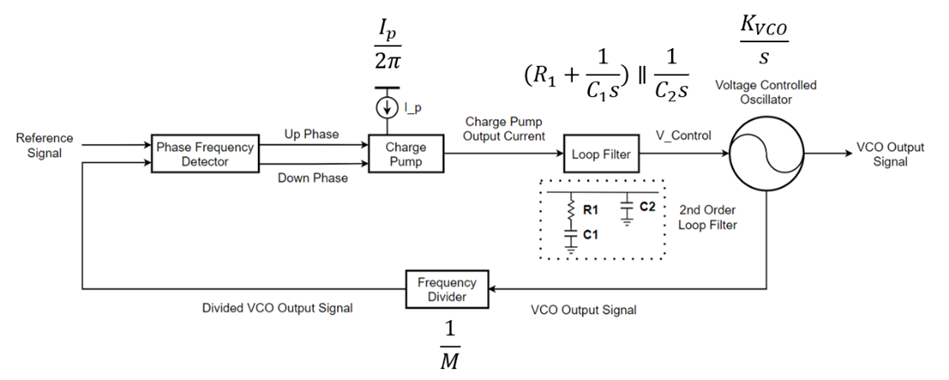
Figure 6: PLL Circuit Representation
Evaluating the results through “Control System Designer App” in simulink will look like this.
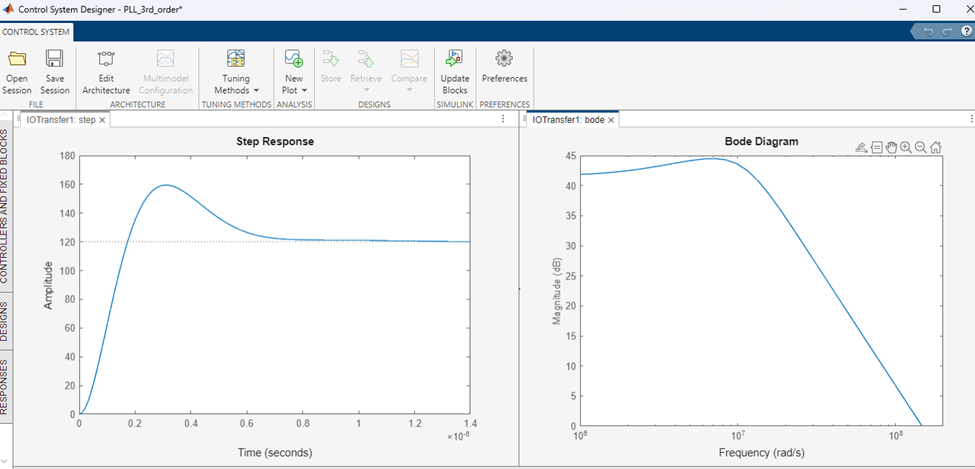
Figure 7: Step Response, Bode Plot
Xschem Implementation
Finally, in Xschem, the schematic looks like this:
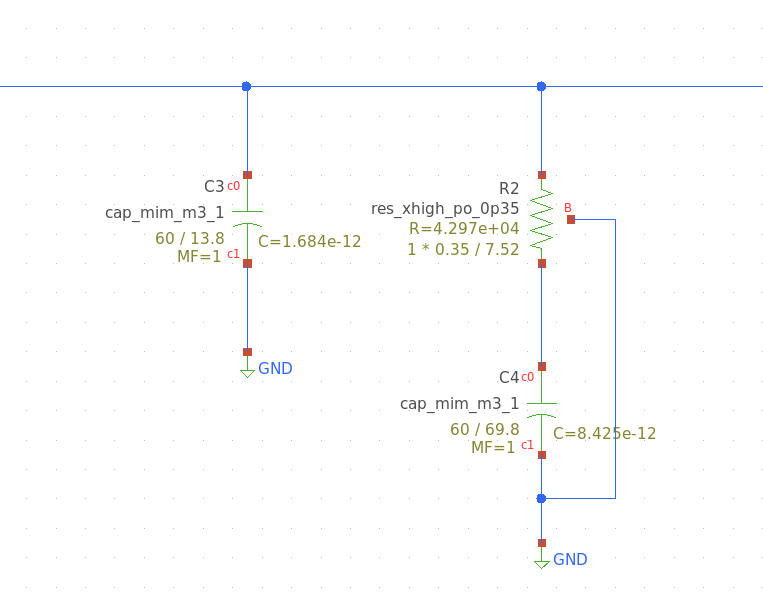
Figure 8: Xschem Implementation
With the loop filter parameters derived and simulated, we finished the design parameter configuration. We can now move on to Phase Freqeuncy Detector (PFD) design in the next post.
Discussion
Comments
Share questions, corrections, or notes through GitHub.